Vibe Coding with 3D Data
Since vibe coding is now a well-established term, I decided to try it on another form of data. I've worked extensively with images, audio, and text, but I had never trained a network on 3D models. Our life exists in 3D, so it only makes sense to understand how to work with 3D data. 🫡
Task: Train a Model That’s Good at Embedding 3D Models
I started with the ModelNet10 dataset and implemented PointNet, a straightforward neural network that accepts unstructured point data and is suitable for classification and segmentation tasks. However, what I really wanted was "3D models → embeddings" (fancy term for a list of numbers that helps computers represent stuff). These embeddings are stored in PointNet’s global feature layer (marked green).
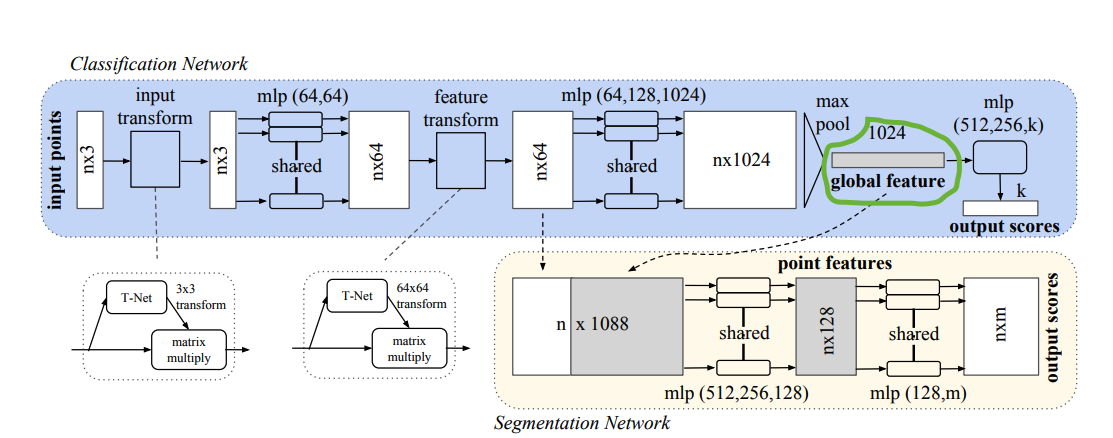
Figure 1: PointNet architecture, with the global feature layer (green) storing embeddings.
Data
First off, the data comes in .off files, a format that represents faces and vertices in a human-readable way. Thanks to this Kaggle notebook, I was able to borrow some code to read the data. In summary:
-
Faces & Vertices: A vertex is a point in 3D space, and a face is the shape created when those points are connected.
-
Mesh: A structured shape, e.g., a Triangular Mesh (a face that looks like a triangle). Below is a visual representation of a bathtub read from a
.offfile: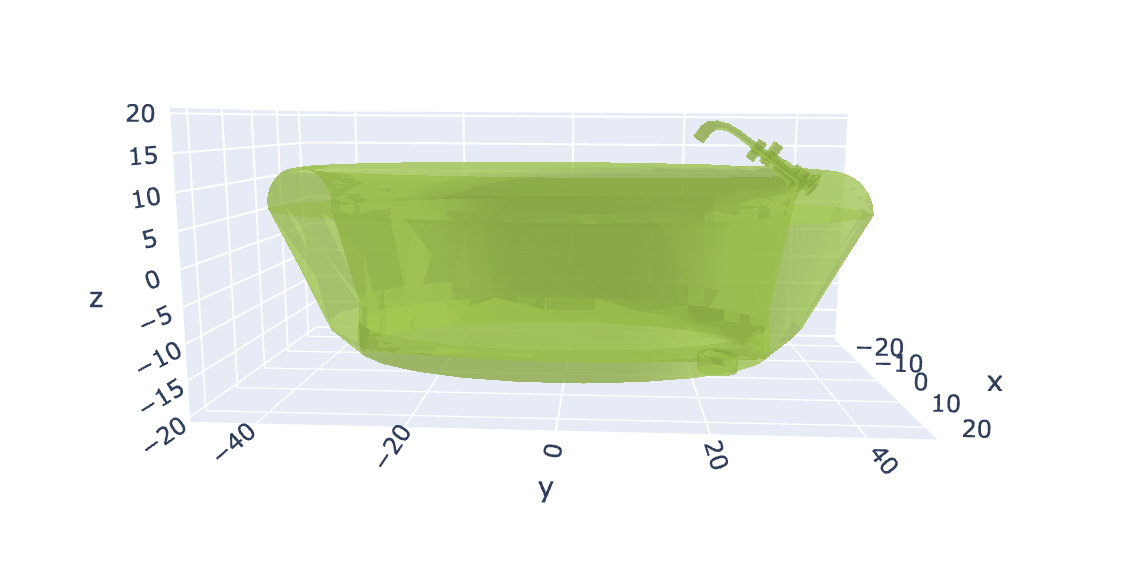
Figure 2: Bathtub mesh representation, showing the structure of the 3D model. -
Once we have the meshes, we need to sample them. Since I’m using PointNet, I sample the mesh into points!
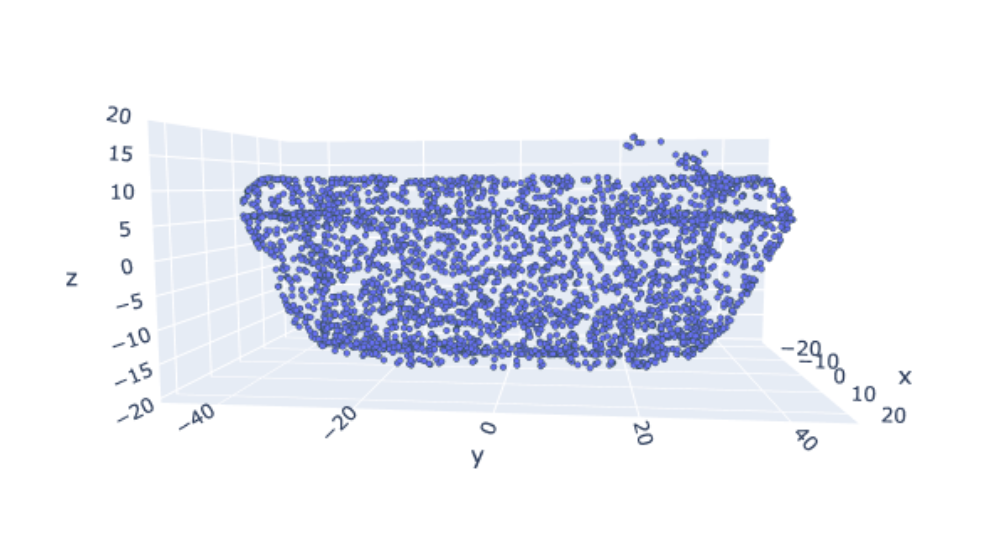
Figure 3: Point cloud representation of the bathtub model, used as input for PointNet.
Self-Supervised Training with NT-Xent Loss
In the real world, data is unlabeled cuz humans are messy. To try and mimic the real world I picked NT-Xent Loss that is usually used in a self-supervised way.
What is NT-Xent Loss?
NT-Xent stands for Normalized Temperature-scaled Cross Entropy Loss, and it’s a key component in contrastive learning. It helps the model learn meaningful representations by ensuring that similar data points (positive pairs) have embeddings that are close together, while dissimilar ones (negative pairs) are pushed apart.
Adding an MLP Head for the Loss
To improve contrastive learning performance, I added an MLP head on top of the global feature layer of PointNet. This MLP head consists of:
- A 512-dimensional dense layer with BatchNorm and ReLU activation.
- A final projection layer that maps embeddings to the space used for NT-Xent Loss.
This projection step is crucial because:
- It improves the separation between embeddings before computing the loss.
- It prevents the network from collapsing into trivial embeddings.
- It learns a better metric space, making embeddings more robust for similarity comparisons.
How Does It Work?
-
Data Pairing Using Labels:
- The anchor and positive come from the same class.
- The negative comes from a different class.
-
Embedding Similarity:
- The MLP head processes embeddings before similarity computation.
- We compute the cosine similarity between all embeddings in a batch.
- The similarity scores are scaled using a temperature parameter (τ), which controls how much we want to separate positive pairs from negative pairs.
-
Contrastive Loss Calculation:
- The loss function ensures that the similarity between positive pairs is maximized, while the similarity with negative pairs is minimized:
How I Selected Positive and Negative Samples
I cheated and used the class labels to construct positive, negative, and anchor samples instead of relying on augmentations.
Since the dataset is labeled, I leveraged the existing class labels for contrastive learning:
- Anchor: A randomly chosen 3D model from a specific class.
- Positive: Another sample from the same class.
- Negative: A sample from a different class.
If the dataset were unlabeled, I would have needed to:
- Augment the same sample to create positives.
- Select a random 3D model as a negative.
- Ensure negatives were not too similar to the anchor by using feature distance constraints.
Evaluation
Loss Curve
Although the training and test loss have been decreasing, meaning the model is learning, the embeddings do not yet form distinct clusters. Ideally, classes should be well-separated, but the visualizations show overlap. Anyways good enough for the weekend and a nice intro to 3D data.
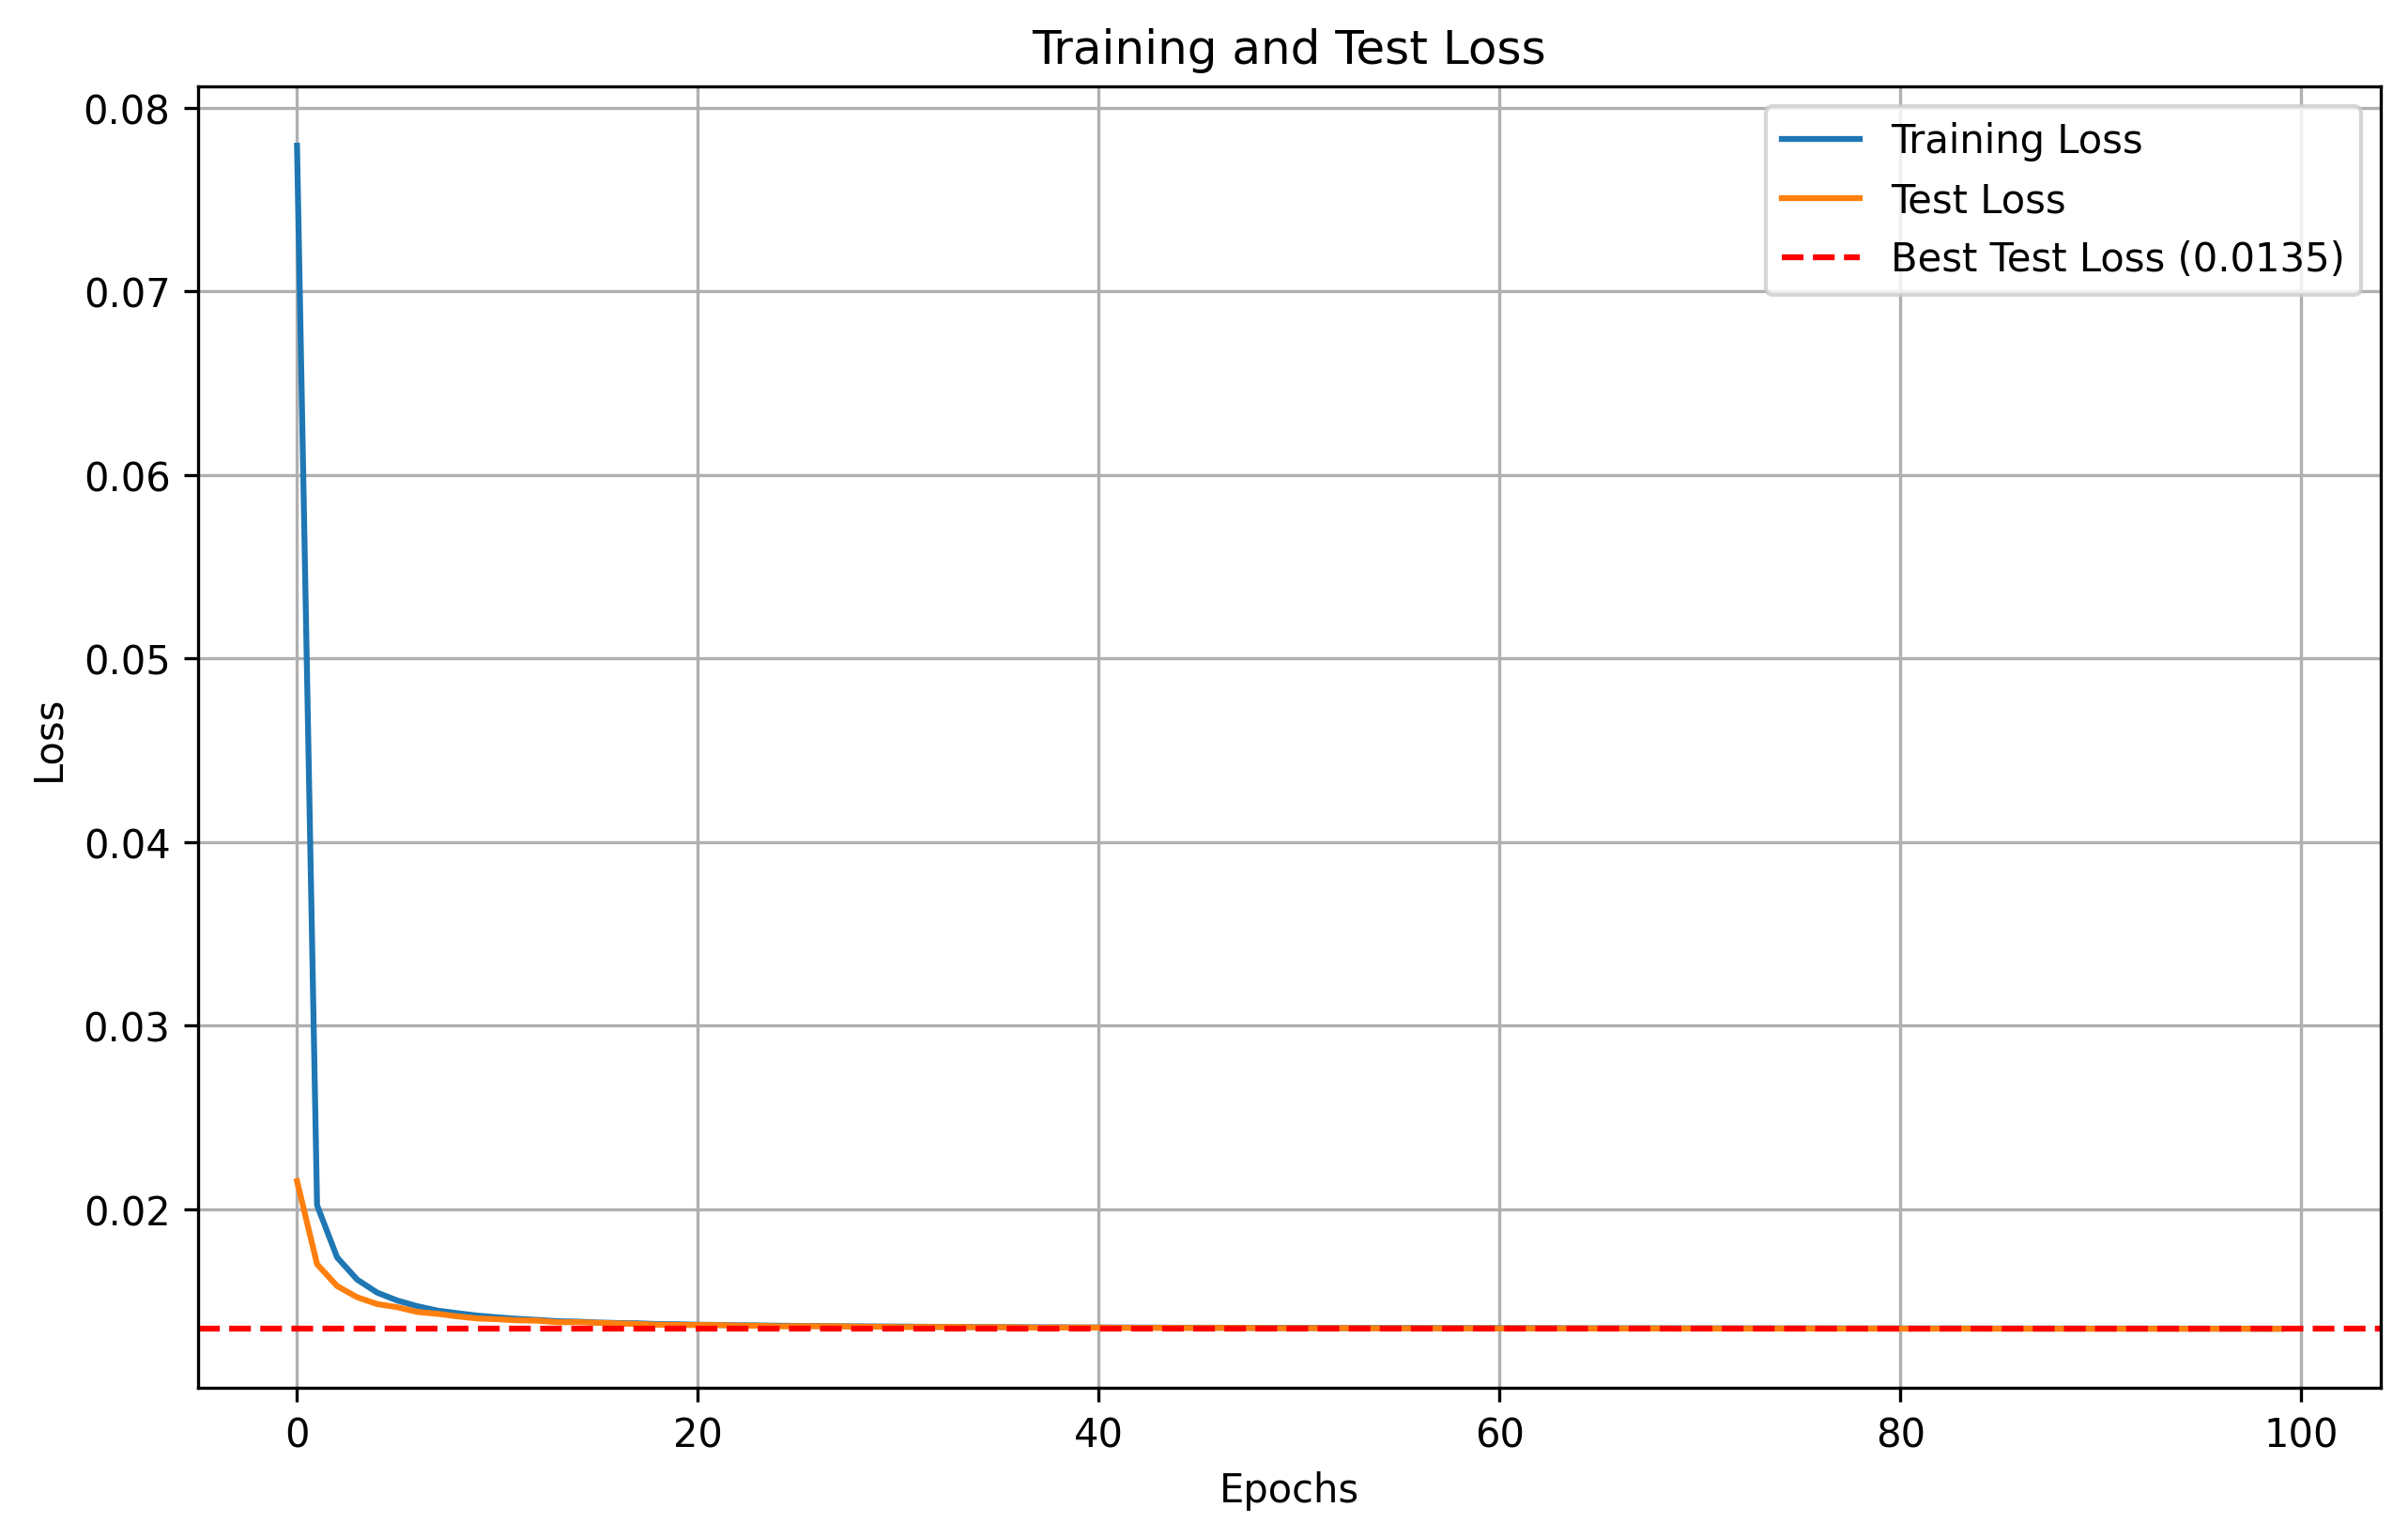
Figure 4: Training and test loss curves, showing model convergence.
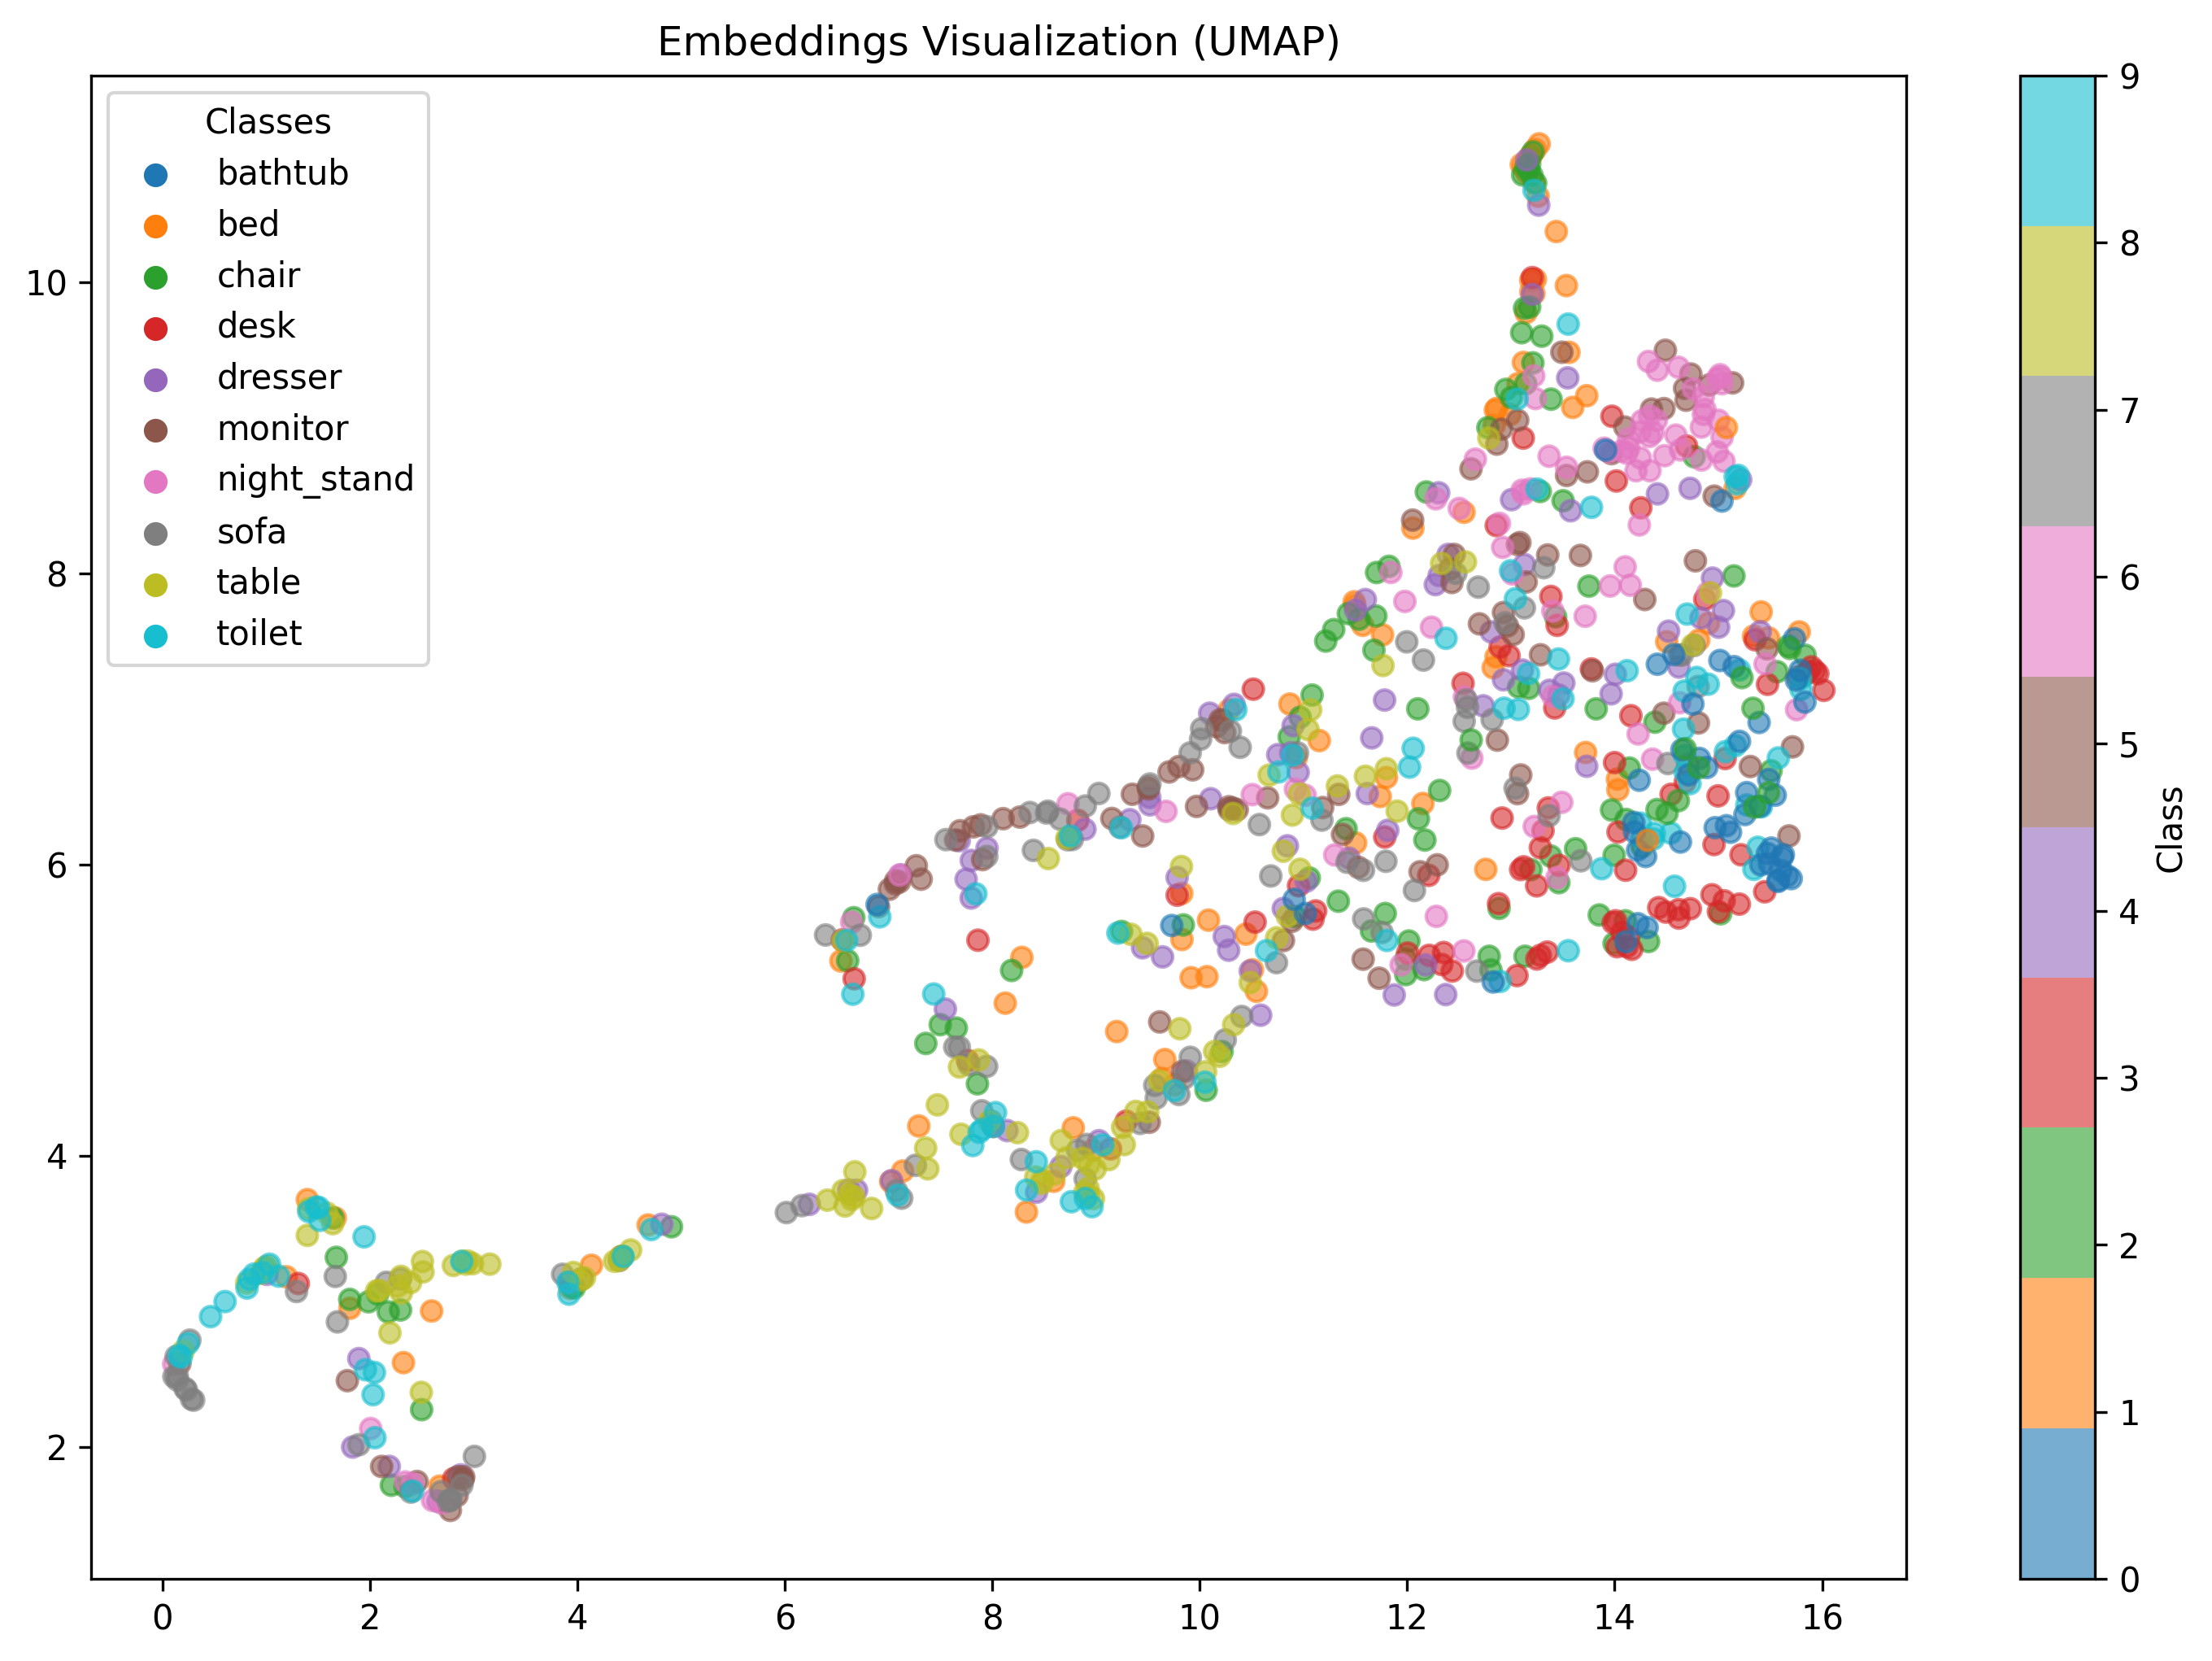
Figure 5: UMAP visualization of learned embeddings at epoch 100, showing class overlap.
Possible Reasons
-
Temperature Parameter (τ)
- If τ is too high, the contrastive loss becomes weak, and embeddings might not separate well.
- If τ is too low, the loss becomes too strict, causing the model to collapse.
-
Insufficient Hard Negatives
- If negative samples are too easy, the model does not learn to separate classes well.
- A better approach would be to implement hard negative mining, selecting negatives closer to the anchor instead of random negatives.
-
Lack of Strong Augmentations
- Augmentations could introduce more variability in positive samples, forcing the model to generalize better.
- Techniques like random rotations, noise injection, and jittering might help improve the model’s robustness.
-
Projection Head Might Be Too Shallow
- A deeper MLP projection head could improve feature learning.
- A wider embedding space (e.g., 256-dimensional embeddings instead of 128) could enhance separation.
Next Steps
- Tune temperature (τ) to find a better balance between positive and negative similarity.
- Improve negative selection by integrating hard negative mining instead of picking random negatives.
- Enhance augmentation pipeline to encourage better generalization.
- Test a deeper MLP projection head to improve the separation of embeddings.
Shoutout to
- My Kaggle and Hugging Face homies
- ChatGPT and Cursor
- Math for being awesome and keeping it real
Challenges and Roadmap
- I want to use a better dataset—finding a reliable 3D dataset is difficult. I requested access to PartNet on Hugging Face and somehow got it. Any suggestions for other datasets?
- Can I use better loss functions? I'm thinking about experimenting with Triplet Loss and Barlow Twins Loss to see if they improve embedding quality.
- Next, I want to populate a vector database (FAISS or Milvus) and perform searches on it.
- Is there a better architecture? A better representation of 3D models other than point clouds? Maybe try PointNet++ or a Transformer-based model?
More to come. Cheers 🥂